Evaluation
My status
Section titled “My status”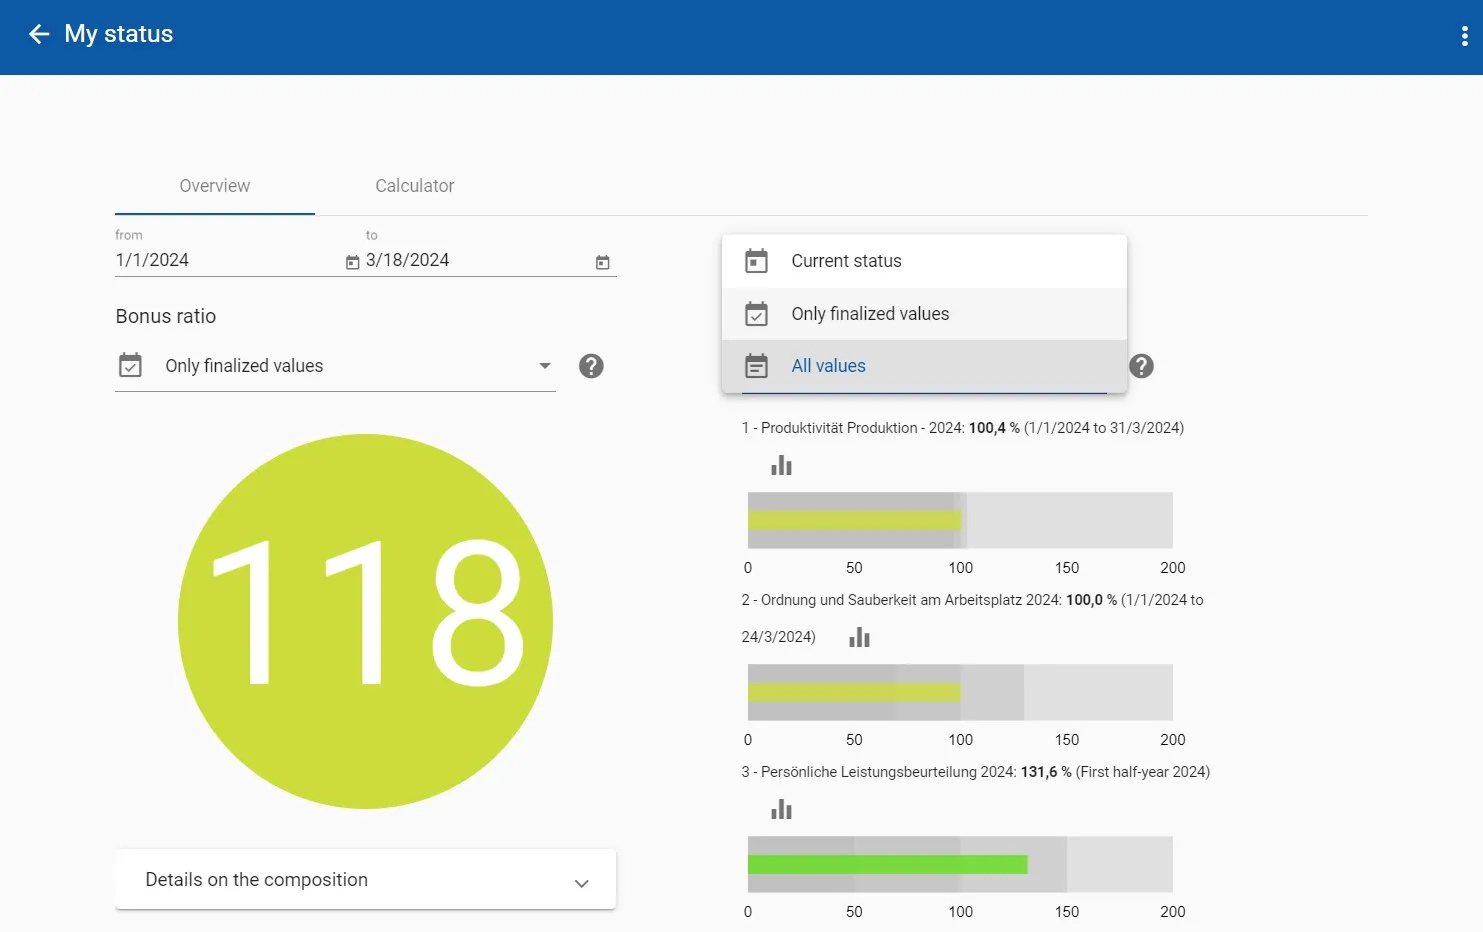
Every employee can find out about the status of their own targets in maXzie. Here he can see the current status of his bonus ratio. This value indicates what bonus he is currently entitled to would be paid out. The bonus ratio is given in percent - this ensures that a colleague, accidental looking over the shoulder, does not find out the amount of the salary. With a value of 100% the full variable component is paid out. Furthermore, the employee sees a graphical representation of the degrees of target achievement for each of his/her targets. The colored bar in the middle indicates the current target achievement value. In the background the lower performance point, the 100% and the upper performance point are shown in different shades of gray. If you move the mouse over it, you can also see the respective value.
By clicking on the diagram icon above each bar chart, you can obtain further information about the goal and a graphical representation of the actual, target and target achievement values.
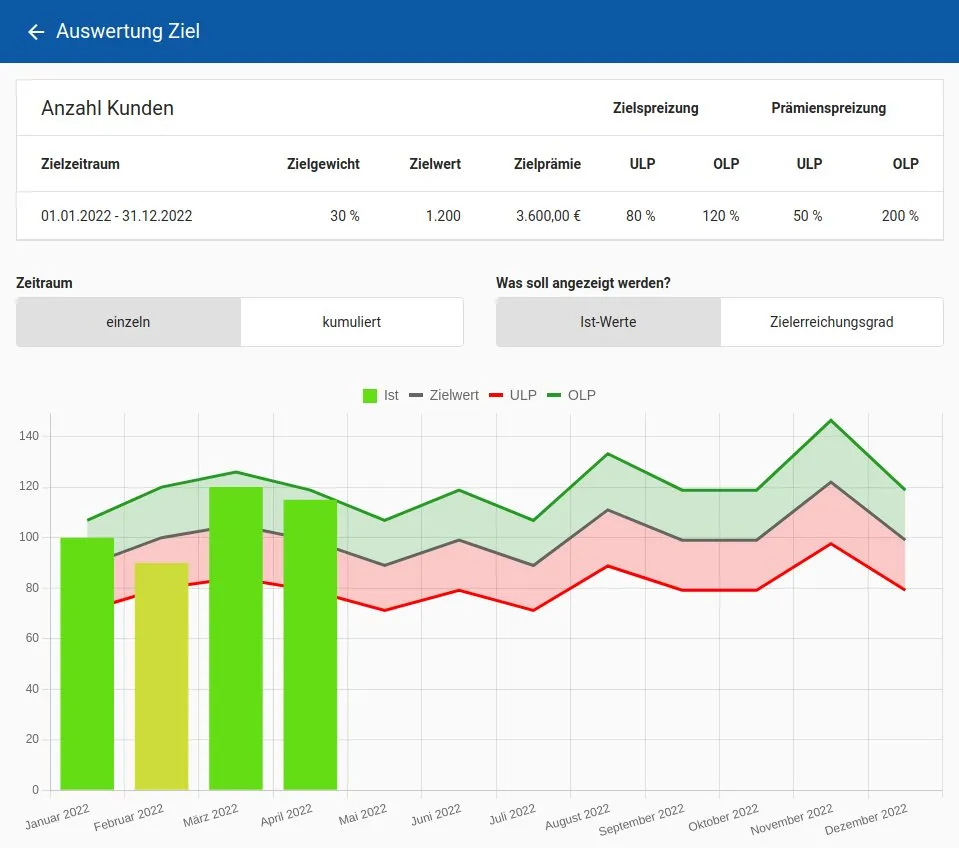
In this view you can find further information about the target. In addition, the actual, target and target achievement values are displayed graphically.
The buttons for Timeframe can be used to select whether the time periods should be viewed individual or cumulated, e.g. for individual in April only the values achieved in April would be displayed, for cumulated the January-April value would be displayed in April . You can use the buttons What do you want to display? to choose between actual values and degree of target achievement.
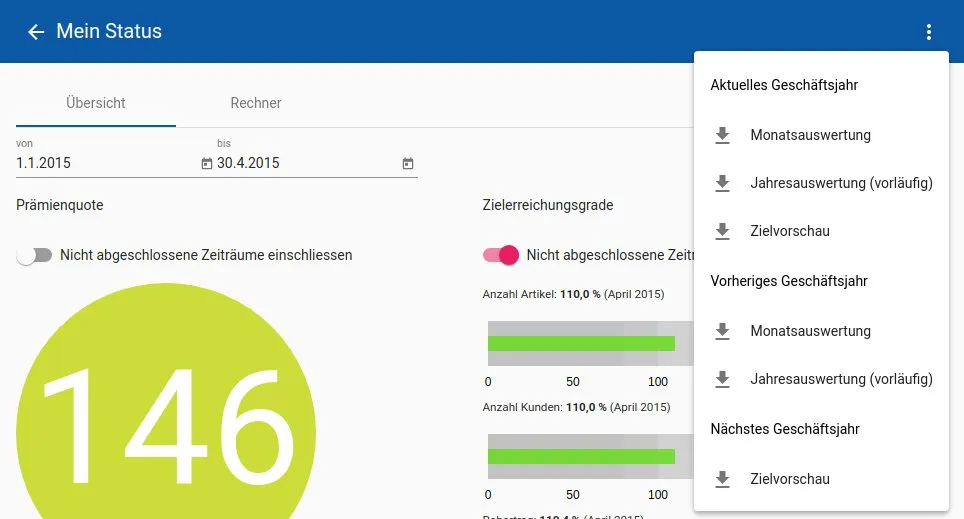
In the upper right corner there is a menu that allows you to download various PDF reports:
- Monthly report: Contains all actual data that was available at the last billing time.
- Annual evaluation (provisional): Contains all actual data, including from the future, and also the target values for the rest of the financial year.
- Target preview: Contains only the target data for the fiscal year.
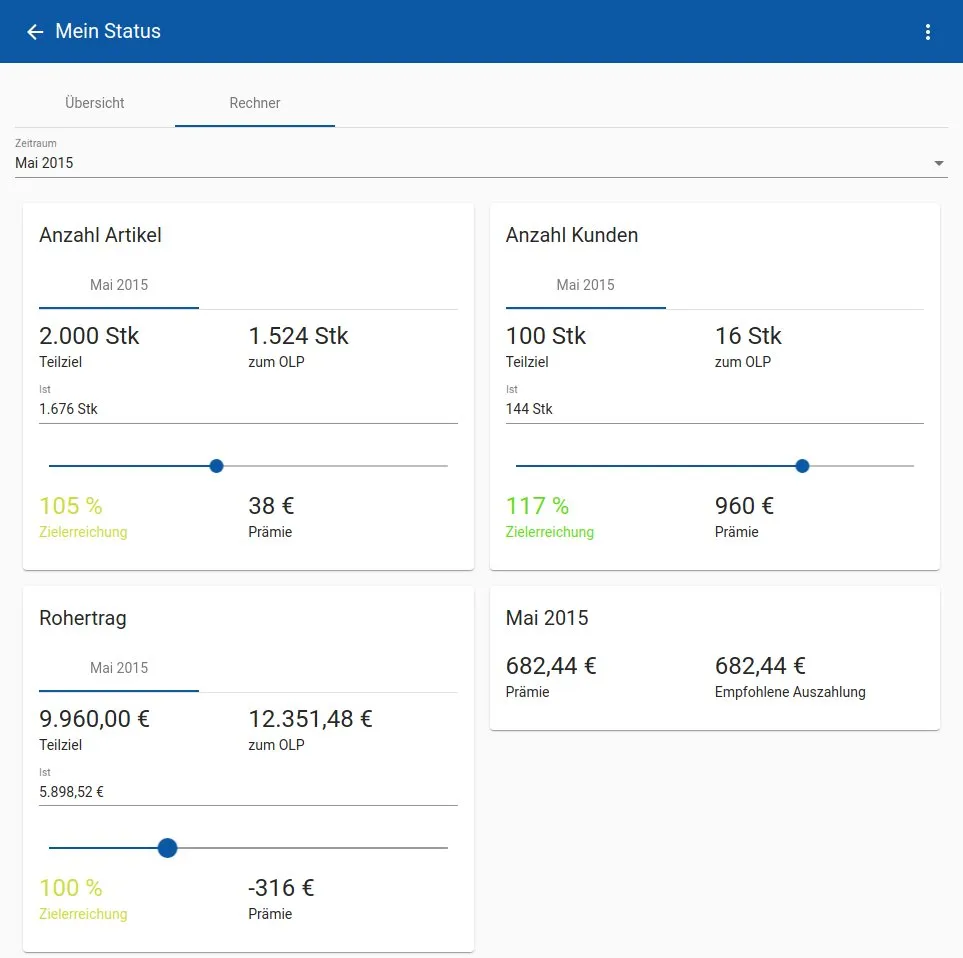
In the Calculator tab, the employee can simulate actual values for current or future periods and receive the answer to the following questions:
- How much power is missing to reach the upper performance point?
- What bonus would I receive for achieving the simulated values?
Overview
Section titled “Overview”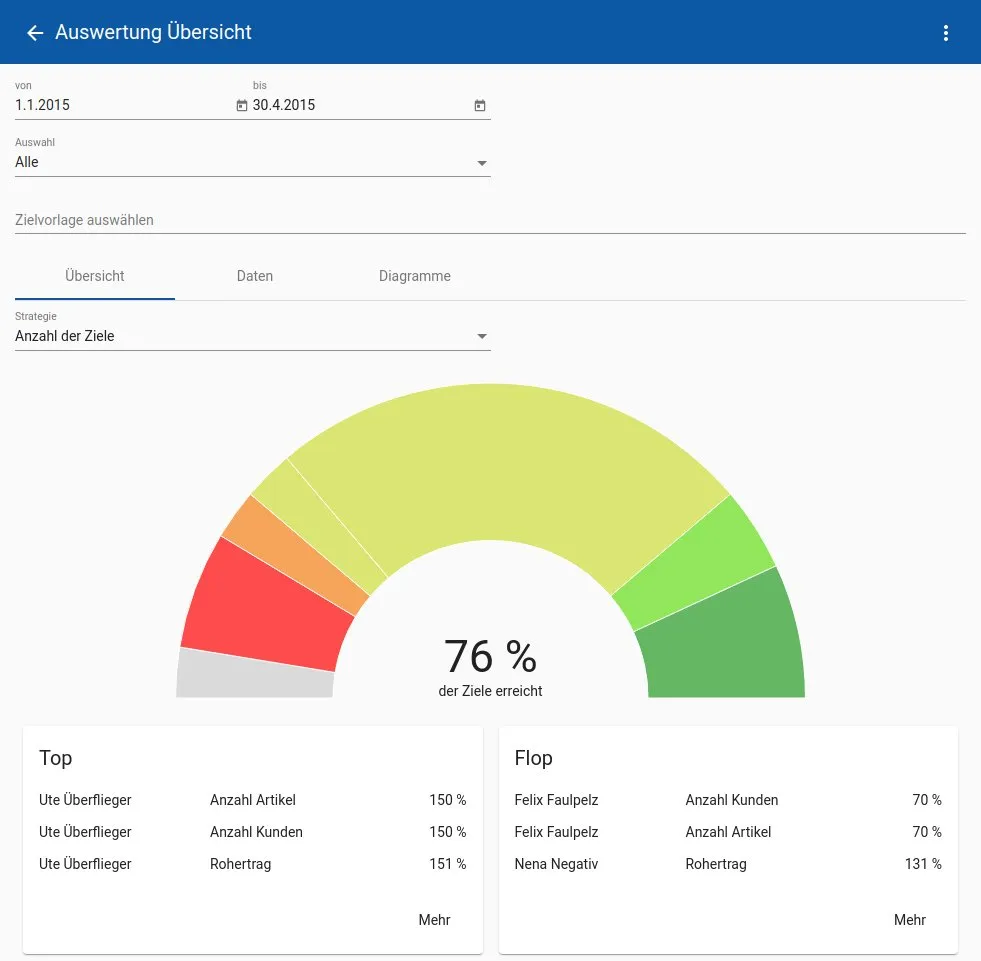
The evaluation overview is available to users with appropriate authorization. The filters at the top of the page can be used to refine the selection of employees and targets displayed. If nothing is selected, all employees and targets for which the user has overview permission are displayed. In the Selection field you can switch between All, Group and Employees. When you select Group, a field for selecting groups opens. When you select Employees, a field for selecting employees opens. If groups are selected and you then switch to Employees, the employees of the selected groups are inserted. The target template field can be used to select targets based on target templates. Only target templates that do not inherit from target templates that have already been selected are available for selection.
The colored semicircle provides information about the number of targets achieved and their degree of target achievement. If you move your mouse over the colored sections, you will receive further information. The Top and Flop cards list the employees with the best and worst levels of target achievement. Clicking on More will load additional employees.
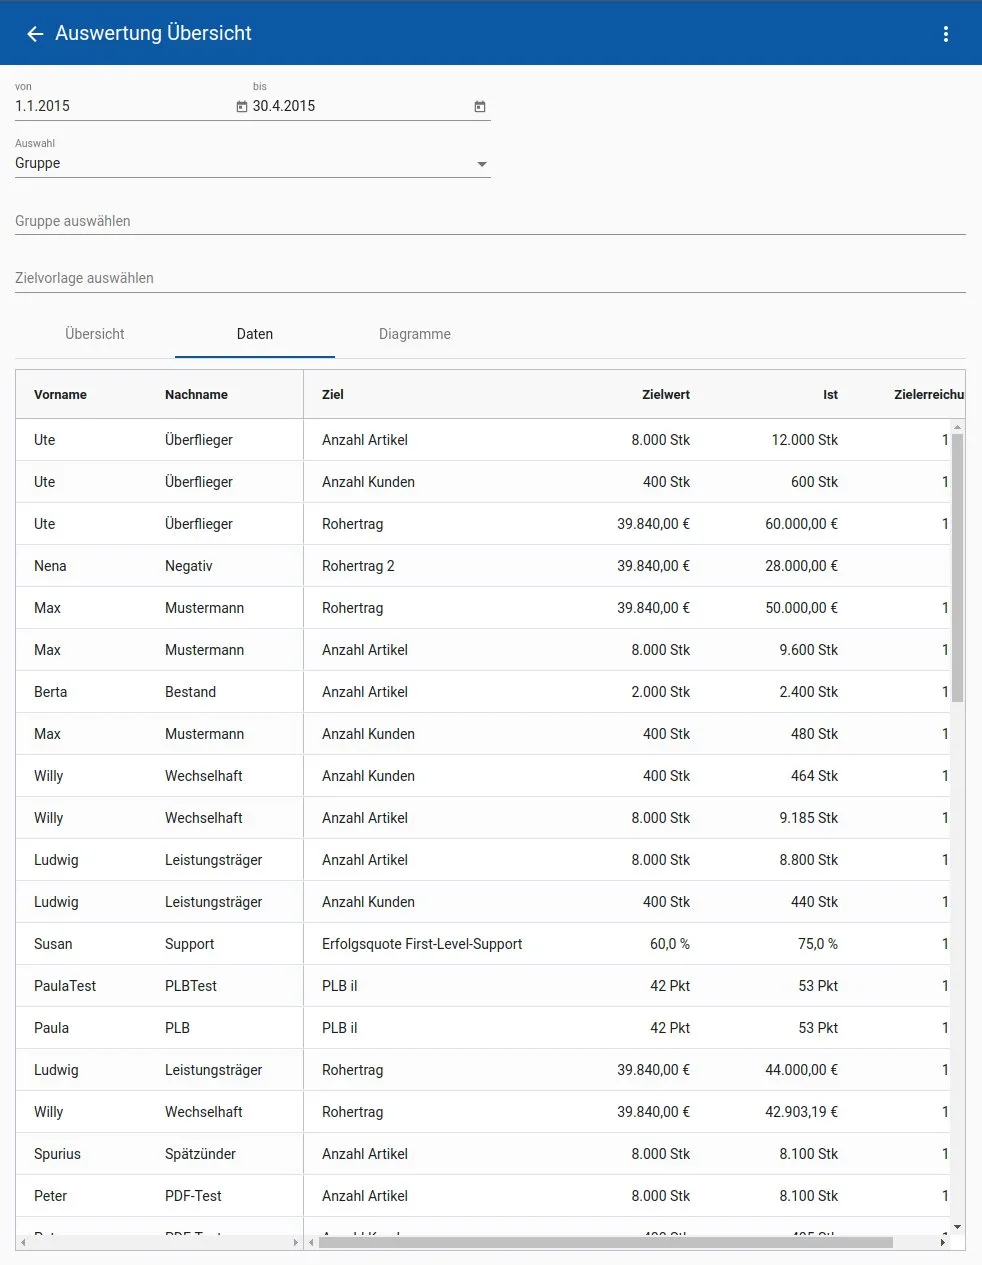
A table of all employees can be called up in the Data tab. This contains information on the different target values, the actual values and the levels of target achievement. This table can be downloaded as either an Excel or CSV file using the three-dot menu.
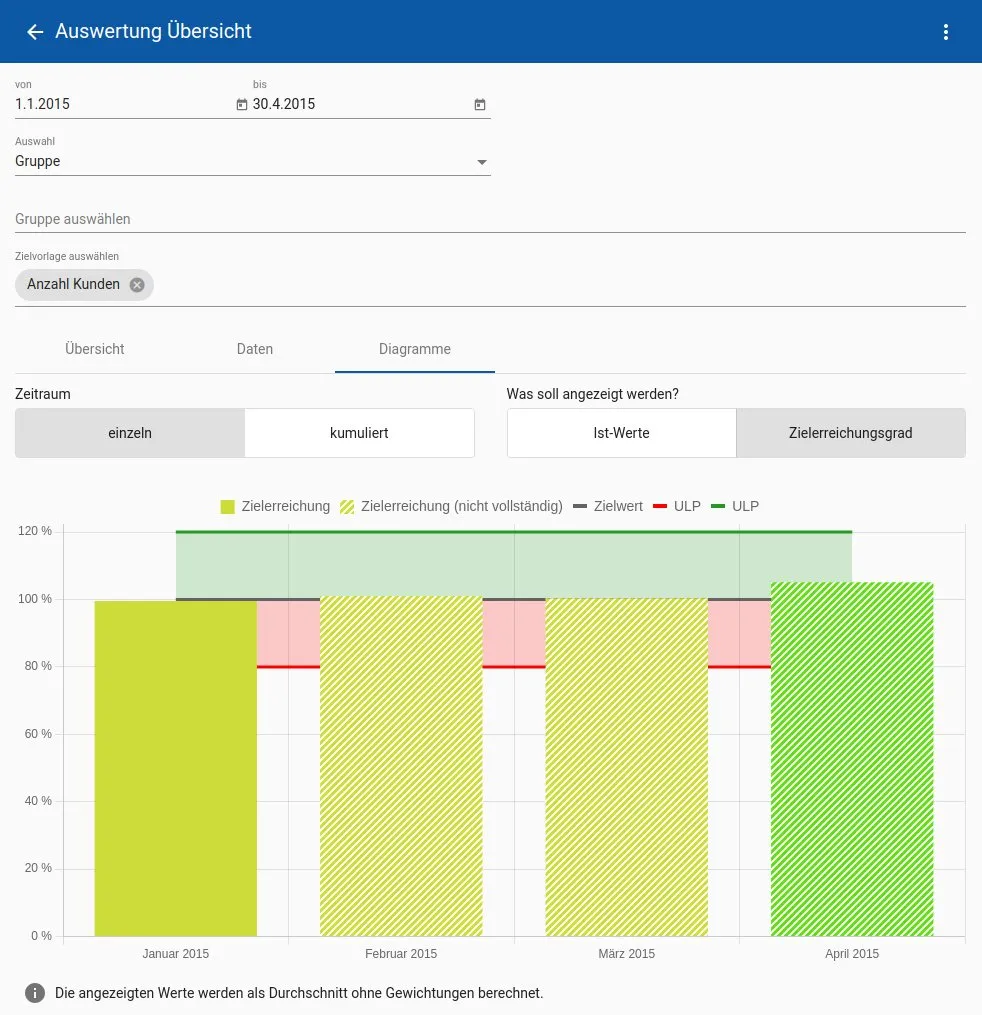
In the Charts tab, the actual, target and target achievement values are displayed graphically. The buttons for Timeframe can be used to select whether the timeframe should be viewed individual or cumulated, e.g. for individual in April only the values achieved in April would be displayed, for cumulated the January-April value would be displayed in April . You can use the buttons What do you want to display? to choose between actual values and degree of target achievement. When you select Actual values, additional selection fields appear How should the actual values be displayed? with the choice between as sum and as an average. Here, all goals are either summed or the average (without weighting) is displayed.
If no diagram is displayed, goals with the same report periodization must be selected using the target templates, i.e. all selected goals must be reported monthly, for example.
Employees
Section titled “Employees”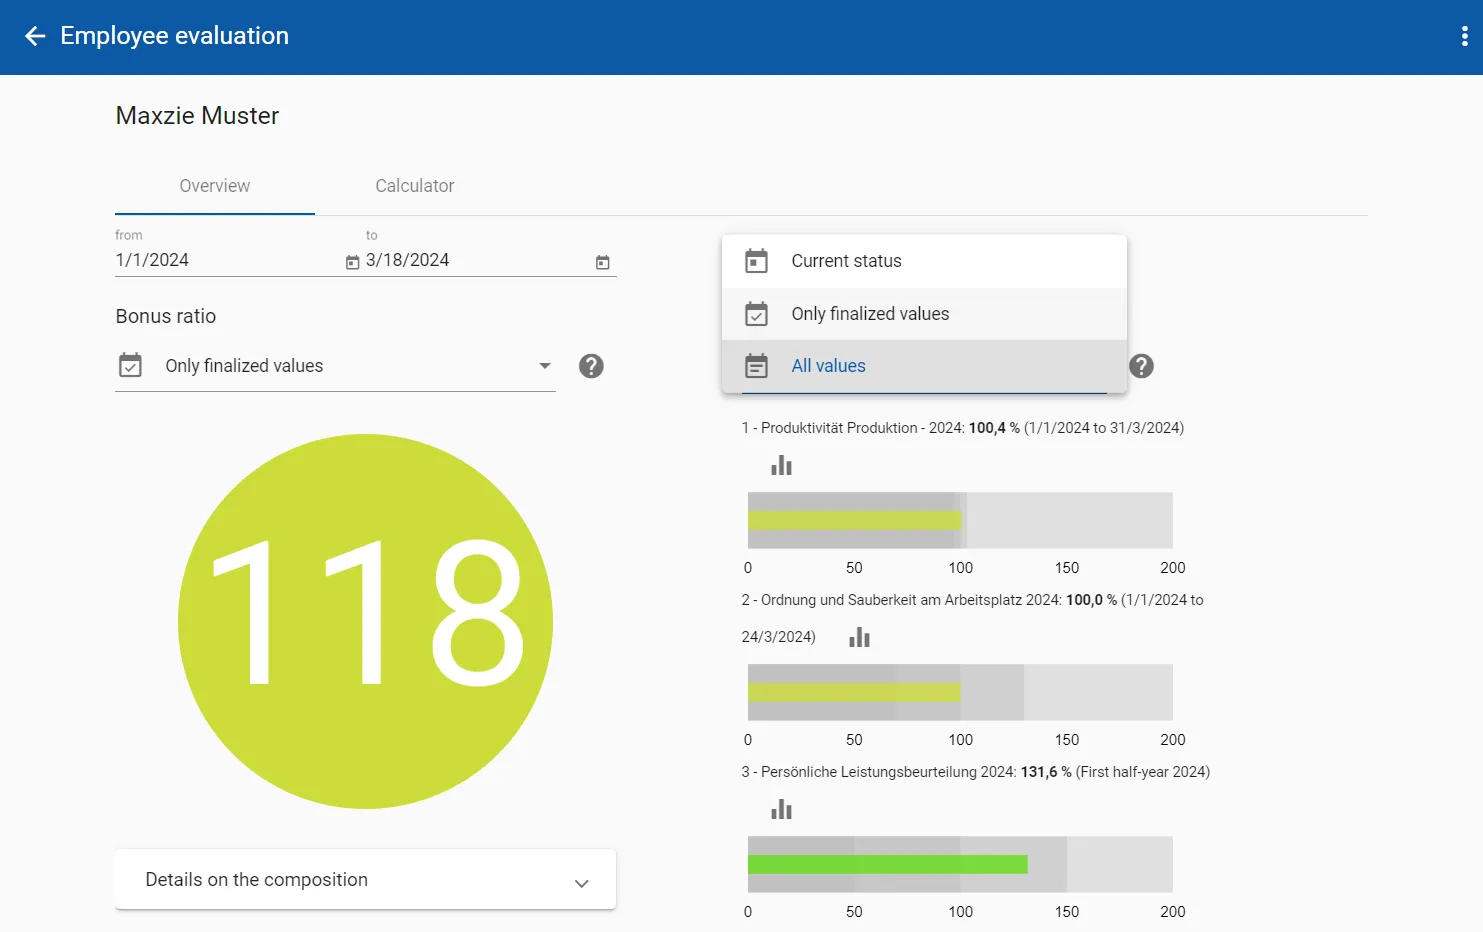
The evaluation of individual employees is available to those with appropriate authorization. This contains the same information as My status of the selected employee.